Course description:
The course introduces basic concepts, methods and procedures of information design with focus on mapping information. It investigates visual systems and information structures such as maps, relational graphs, timelines and diagrams. Emphasis is placed on the exploration of conceptual and visual solutions, and on the creative process of organizing, visualizing and communicating information. The objective is to examine design solutions that make complex information easier to understand and to use by a specific audience. The course is delivered as studio projects, individual and class critiques, lectures, discussions, and readings. The course is required for Graphic Design majors, Department of Art + Design, Northeastern University. The class meets once a week for three and half hours for 14 weeks.
Learning Objectives:
• To develop basic critical language and procedures used in information design;
• To learn how to analyze, organize, visualize and communicate information;
• To explore methods of research, design and testing in the field of information design;
• To explore how to communicate complex information to a specific audience.
ASSIGNMENTS:
For description and student work prior to 2009 please visit previous archive, which requires Flash player. Below I present selected work from 2009–2014.
Assignment #1 :
Task: The assignment consists of weekly diagrams communicating facts. The goal is to create a series of three diagrams communicating regional facts to an audience of undergraduate students. Diagrams should share common visual vocabulary, as they will be considered as a group. Duration: 4 weeks.
-
- Tiffany Warren, 2010
-
- Ryan Fleming, 2010
-
- Laura Upham, 2010
-
- Kimberly Donoughe, 2010
-
- Kristin Richardson, 2010
-
- John Daigneault, 2010
-
- Danielle Morimoto, 2014
-
- Danielle Morimoto, 2014

Assignment #2 :
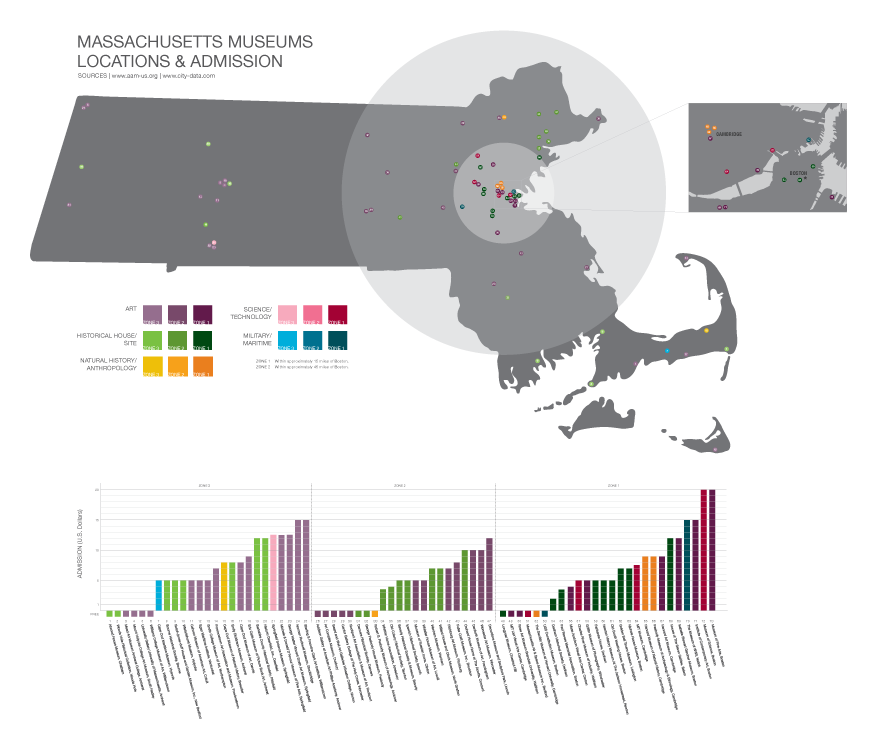
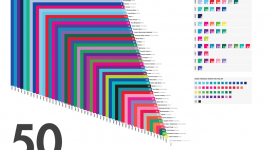
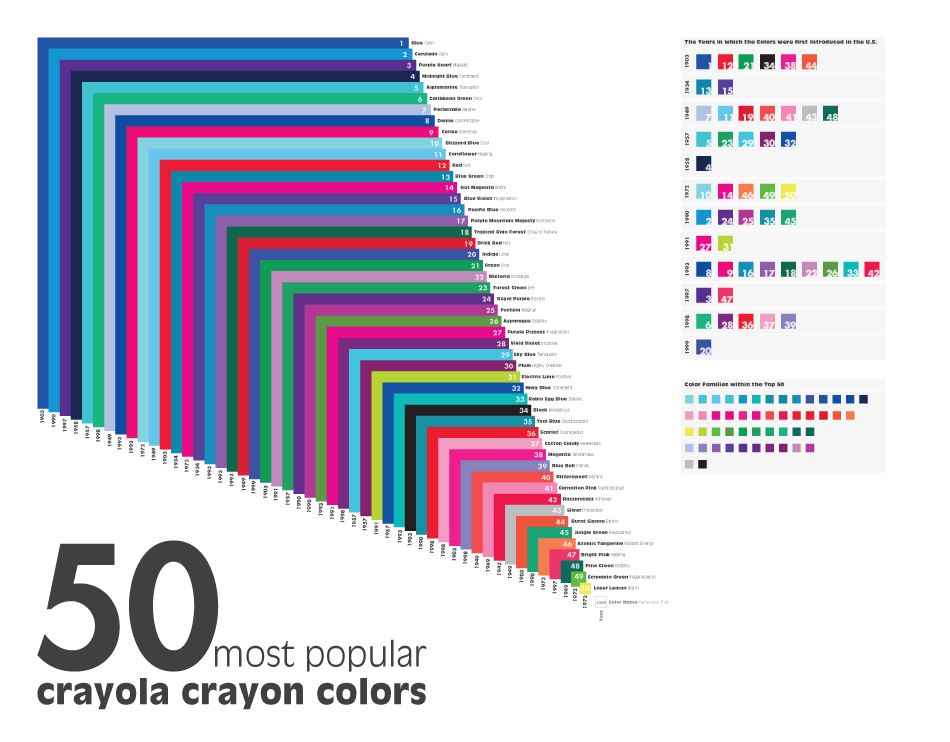
Task: The goal is to create a visualization that communicates national facts to an audience of undergraduate students. Students collect a minimum of 35 data points in addition to related attributes so that the visualization will reveal at least two aspects of the selected topic. Duration: 5 weeks (not counting with collecting data time).
-
- Faith Donnelly, 2013
-
- Jordan Beckvonpeccoz, 2014
-
- Sally Mei, 2014
-
- Danielle Morimoto, 2014
-
- Lee Hodson, 2014
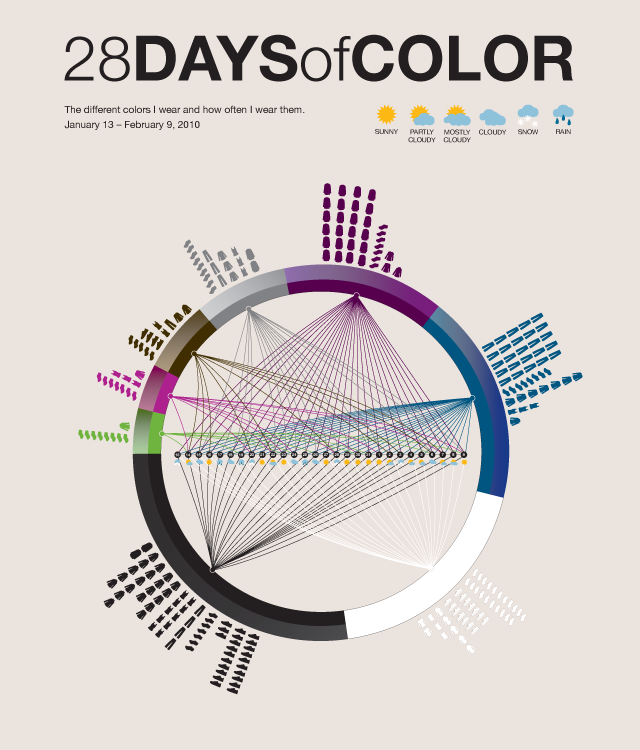
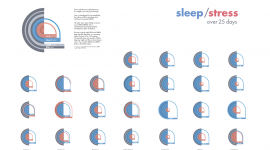
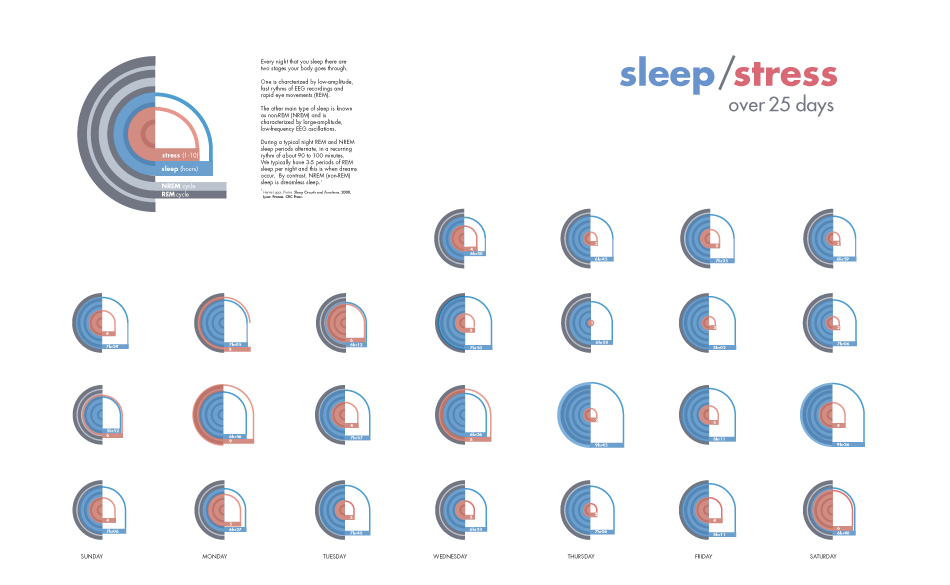
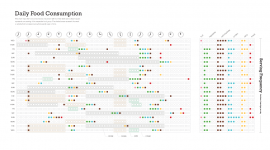
Task (up to 2009): The goal is to structure and communicate a personal set of data that the student (will) have experienced in 4 consecutive weeks. The audience is an adult not familiar with the student, who should be able to learn something about their routine. Duration: 5 weeks (not counting with collecting data time).
-
- Tiffany Warren, 2010
-
- Kristin Boice, 2010
-
- Kimberly Donoughe, 2010
-
- Heather Stirling, 2010

-
- Kristin Richardson, 2010

-
- Lisa Jeon, 2010
-
- Jillian Bass_2010

Assignment #3 :
Task (2009-2010): The goal is to create a visualization that communicates the facts to your selected audience. Students collect a minimum of 60 data points in addition to their related attributes so that the visualization reveals at least three aspects of the selected topic. The audience is defined by the student. Duration: 5 weeks (not counting with collecting data time).
-
- Laura Upham, 2010

-
- Veronica Zhu, 2010

-

- Rayn Fleming, 2010

-
- Tiffany Warren, 2010
-

- Gina Leslie, 2010
-
- Nader Boraier, 2010
-
- Faith Donnelly, 2013
-
- Aaron Tenbuuren, 2013
-
- Emma Montgomery, 2014
-
- Jordan Beckvonpeccoz, 2014
-
- Danielle Morimoto, 2014
-
- Sally Mei, 2014